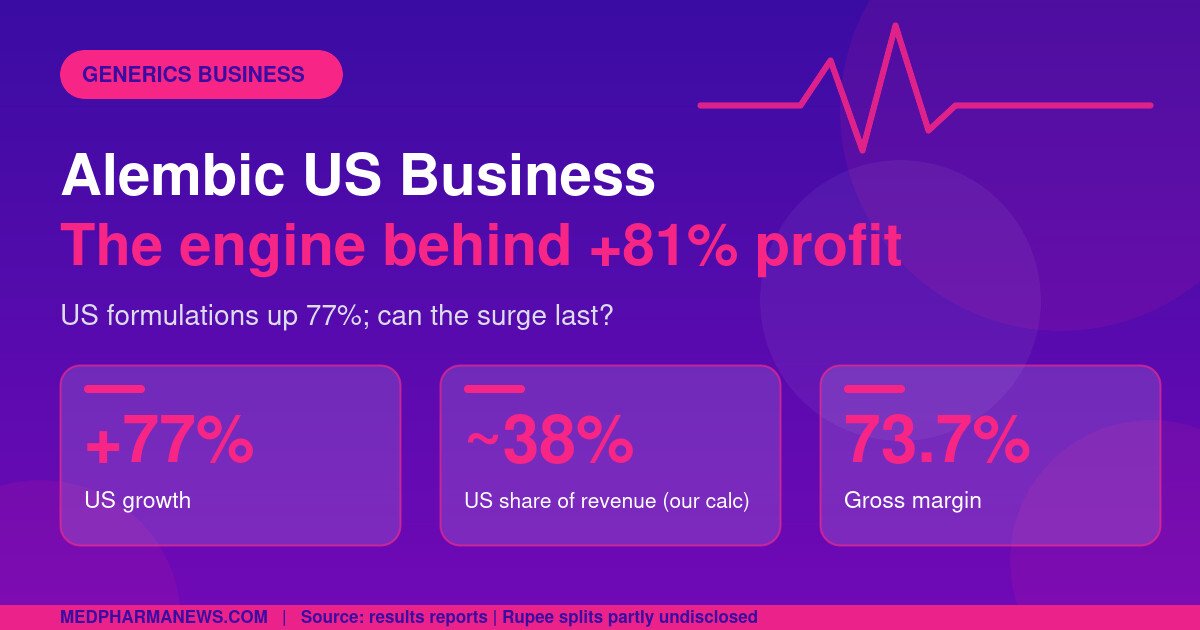
The Alembic US business was the main engine of the company’s quarter ended 30 September 2026, with US sales up 77%, helping to lift group revenue about 36% to roughly ₹2,603 crore and net profit about 81% to around ₹335 crore. For investors and industry watchers, the question is not whether the quarter was strong but how much of it is repeatable. This analysis breaks down the US contribution, the margin story and the unknowns.
Key takeaways on the Alembic US business
- US sales rose 77%; one report puts US formulations at about ₹1,003 crore, roughly 38% of group revenue by our calculation.
- Group revenue rose about 36%, EBITDA about 78% and the EBITDA margin by about 520 basis points.
- Net profit was about ₹330 crore to ₹335 crore; reported growth ranges from 74% to 94%, with 81% most commonly cited.
- Other segments: API up 39%, India branded up 14%, ex-US up 12%.
- R&D steady at about 8% of revenue; first-half revenue about ₹4,753 crore, up 31%.
How much of the growth is the US?
Using the figures reported, US formulations of about ₹1,003 crore up 77% imply a prior-year base of roughly ₹567 crore and an increase of about ₹436 crore. Group revenue rose from roughly ₹1,914 crore to ₹2,603 crore on the reported 36% growth, an increase of about ₹690 crore. These are our calculations from reported figures. They suggest that the US accounted for about 63% of the revenue increase, with API, India and the rest of the world sharing the remainder.
| Item | Value (our calculation where marked) | Basis |
|---|---|---|
| US formulations | About ₹1,003 crore | One report |
| Implied prior-year US base | About ₹567 crore | Our calculation |
| US revenue increase | About ₹436 crore | Our calculation |
| Group revenue increase | About ₹690 crore | Our calculation from 36% growth |
| US share of increase | About 63% | Our calculation |
Margins and operating leverage
EBITDA grew 78% on revenue growth of 36%. Gross margin was 73.7%, up only 70 basis points, so most of the 520 basis points of EBITDA margin gain came from spreading costs over a larger sales base. R&D held at about 8% of revenue, which means the company did not cut research to flatter profit, a point analysts usually check.
The questions investors typically ask (our framing)
The sources we reviewed do not answer the following. What products drove US growth, and how many are exposed to price erosion as competitors launch? Did any launches with limited competition contribute temporary revenue? How much of US sales is branded versus generic, given that management cited US branded traction? How might exchange rates have affected reported rupee growth? We therefore avoid projecting the 77% rate forward.
Three ways the US story could develop (our framing)
- Durable: the growth reflects a broad product portfolio and branded traction, so the US keeps contributing at a high level, though growth rates would normally slow as the base gets bigger.
- Normalising: part of the quarter reflects launches or pricing that fade, and US growth returns to a more ordinary rate while margins give back some of the gain.
- Volatile: US sales swing from quarter to quarter with competition and launch timing, which is common in generics and makes single-quarter growth rates a weak guide.
The company has not said which of these it expects, and the summaries we reviewed give only qualitative outlook statements. A sensible way to track the story is to watch US revenue in rupees over several quarters, not the percentage growth in any one quarter, because the comparison base was lower a year ago.
Why concentration matters
When one market supplies about 63% of the revenue increase, as our estimate suggests, the company’s earnings become more sensitive to events in that market: price negotiations with large buyers, regulatory inspections, tariffs or exchange-rate moves. The reports do not discuss any such risks for Alembic specifically, and we do not suggest any has materialised. We simply note that concentration cuts both ways.
Profit definitions: why reports differ
Reports vary on profit (about ₹330 crore or ₹335 crore) and growth (74% to 94%). The figure of 81% fits ₹335 crore against ₹185 crore a year earlier. The others may reflect different bases or rounding, though the sources do not say. The filing on the BSE website is the authority.
Timeline
- 30 September 2026: quarter ends.
- Early November 2026: results announced.
- Summaries project continued growth and return on capital employed of about 15% to 16%; no numerical targets.
Market context: generics and API
According to Acumen Research And Consulting, the global generic drugs market is projected to reach about USD 627.6 billion by 2027 at a compound annual growth rate of around 11.1% for 2020 to 2027, with North America holding the major share and Asia-Pacific the fastest growth. The page was last updated in April 2021 and relies on 2014 statistics, so it is dated.
For API, Acumen’s Active Pharmaceutical Ingredient Market report, updated in June 2026, gives USD 255.47 billion in 2025 rising to USD 473.20 billion by 2035, a 6.3% compound annual growth rate for 2026 to 2035, with North America over 39% and Asia-Pacific 25%. Neither report measures Alembic’s sales.
Our analysis
In our assessment, Alembic’s results are a good demonstration of how concentrated a generics company’s earnings can be: one market accounted for most of the growth. That is positive while US demand holds and risky if it does not. The margin gain suggests the company has real operating leverage, but it also means profit is sensitive to a slowdown in the US. We make no forecast of earnings or share price.
What is not disclosed
- Product-level US sales and launch contributions.
- Rupee revenue for API, India and ex-US in the reports reviewed.
- Any one-off items.
- Numerical guidance.
Risks and caveats
- US generic pricing can move quickly.
- Reports differ on profit and growth rates.
- Our calculations rely on reported figures that we could not verify against the filing.
- This article is not investment advice.
What to watch next
- Third-quarter US sales.
- Commentary on pipeline and launches.
- Margin trend as growth normalises.
- Filing details on exceptional items.
General background
Company information is at Alembic Pharmaceuticals. Related coverage: Laurus Labs’ Q2 results and CDMO mix and the pharmaceuticals section.
Questions readers are asking about the Alembic US business
How much did US sales grow?
77% in the quarter ended 30 September 2026.
What share of revenue is the US?
About 38% by our calculation from one report’s US formulations figure.
Will growth continue?
The sources do not say, and we make no forecast.
FAQ
What is operating leverage?
When sales grow faster than operating costs.
What is a basis point?
One hundredth of a percentage point.
What is the R&D share?
About 8% of revenue.
How we reported this: details come from reports of Alembic Pharmaceuticals’ Q2 FY27 results; we did not review the filing, and calculations marked as ours are our own. Market figures are attributed to Acumen Research And Consulting. Last updated 4 November 2026. This is news reporting and not investment advice.