The artificial organs market was valued at US$28.71 billion in 2025 and is projected to surpass US$63.31 billion by 2035, growing at a compound annual growth rate (CAGR) of 8.2% over 2026-2035, according to market data from Acumen Research and Consulting. North America led with a 39.96% share in 2025, and artificial kidney was the largest organ segment at 45.00%. These are analyst estimates, and this article sets out what sits behind them and where they should be read with care.
Key Takeaways
- The artificial organs market is estimated at US$28.71 billion in 2025 and projected to top US$63.31 billion by 2035, an 8.2% CAGR.
- North America held 39.96% in 2025 and is forecast to grow at 8.8% a year; Europe followed with 27.86% and an 8.6% CAGR.
- Artificial kidney led by organ type with 45.00%, while artificial liver is the fastest-growing segment at a 28.6% CAGR.
- Implantable devices held 73.00% of the market, with externally worn or wearable devices at 17.00%.
- Silicone is the leading material (27.00%) and mechanical or fluidic technology the leading technology (38.00%).
What Are Artificial Organs?
Artificial organs are engineered devices or constructs that take over, support or replace the function of a failing natural organ. They include dialysis-based artificial kidneys, heart pumps and valves, cochlear and other sensory implants, and emerging liver-support systems that combine filtration, detoxification and cell-based approaches. They are used when a patient cannot wait for a donor organ, is not eligible for a transplant, or needs support while a transplant is arranged.
The artificial organs market sits alongside the wider transplantation market, where donor supply and rejection management shape demand for alternatives. The Organ Procurement and Transplantation Network publishes national transplant and waiting list data for the United States, which gives context for why device-based replacement and support remain important.
Artificial Organs Market at a Glance
| Metric | 2025 figure (Acumen) |
|---|---|
| Global market size | US$28.71 billion |
| 2035 projection | Above US$63.31 billion (8.2% CAGR, 2026-2035) |
| North America | 39.96% share, 8.8% CAGR |
| Europe | 27.86% share, 8.6% CAGR |
| Organ type | Artificial kidney 45.00%; artificial liver fastest at 28.6% CAGR |
| Mode of use | Implantable 73.00%; wearable 17.00% |
| Duration of use | Permanent 40.00%; long-term/chronic 35.00% |
| Material | Silicone 27.00%; polyurethane/other polymers 25.00% |
| Technology | Mechanical/fluidic 38.00%; electronic/sensor-controlled 25.00% |
| Functional mechanism | Mechanical 43.00%; electronic/electromechanical 27.00% |
Market Size and Growth Outlook
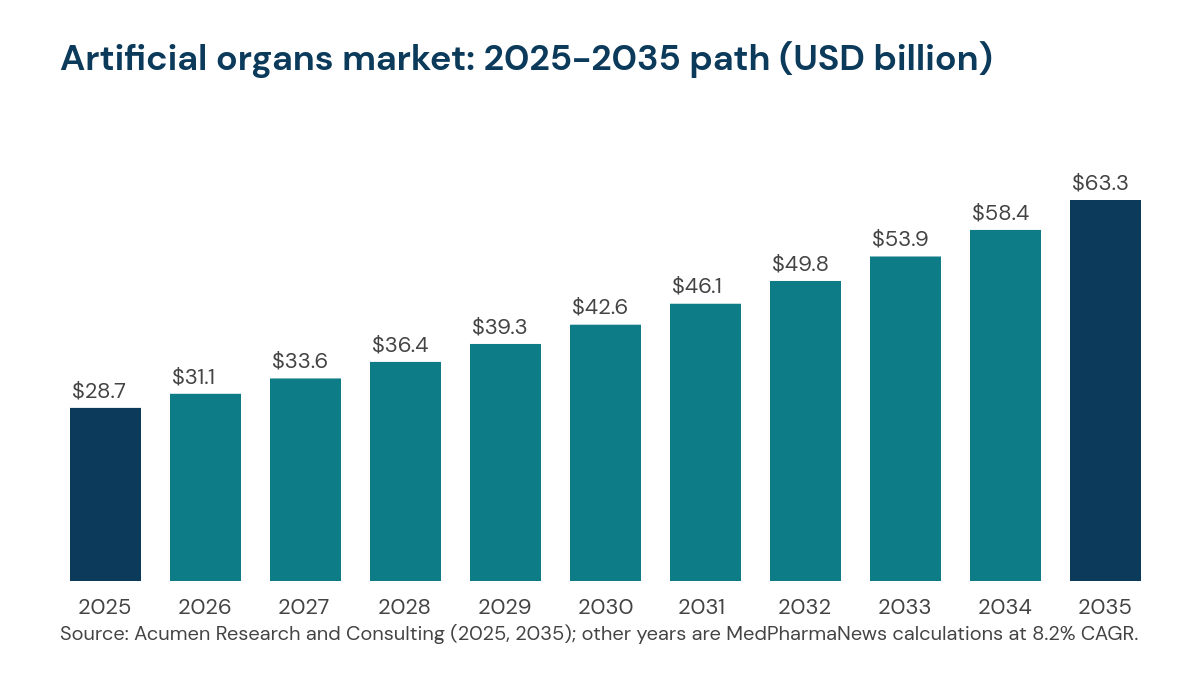
At 8.2% a year, the artificial organs market would grow about 2.2 times between 2025 and 2035. That is a steady rate for a medical device category whose demand is tied to chronic disease and ageing populations rather than to a single new technology. The 2026 value implied by the stated CAGR is roughly US$31 billion, which is our own arithmetic and not a figure published by the research firm.
The first chart shows the path from the 2025 estimate to the 2035 projection. The endpoints are Acumen figures; the years between are calculated by compounding the stated growth rate and are not reported values. Real markets move in steps as products are approved and as hospital budgets change.
North America is projected to grow faster than the global average, at 8.8% a year from 2026 to 2035. Acumen links its lead to advanced healthcare infrastructure, high healthcare expenditure, adoption of sophisticated medical technology and strong research and development capability. Europe, the second-largest region, is projected at 8.6% a year, supported by established healthcare systems, an ageing population and a strong medical research base.
What Is Driving Demand
Several forces support growth in the artificial organs market, and they reinforce one another.
- Sustained renal demand: kidney replacement therapy needs recurring equipment and consumables, and this recurring requirement underpins the size of the kidney segment. Related access devices are covered in our hemodialysis catheters market analysis.
- Liver support innovation: continued development of bioartificial, cell-based, filtration and detoxification technologies is behind the 28.6% growth projected for artificial liver.
- Miniaturised technology: advances in sensors, portable power, wireless connectivity and compact device design are enabling wearable artificial organs, which held 17.00% in 2025.
- Ageing populations and chronic disease: older adults are more likely to develop organ failure, and longer lives raise the number of years patients need organ support.
- Materials and manufacturing progress: better polymers and methods, including the 3D bioprinting market, are widening what devices can do.
Segment Insights
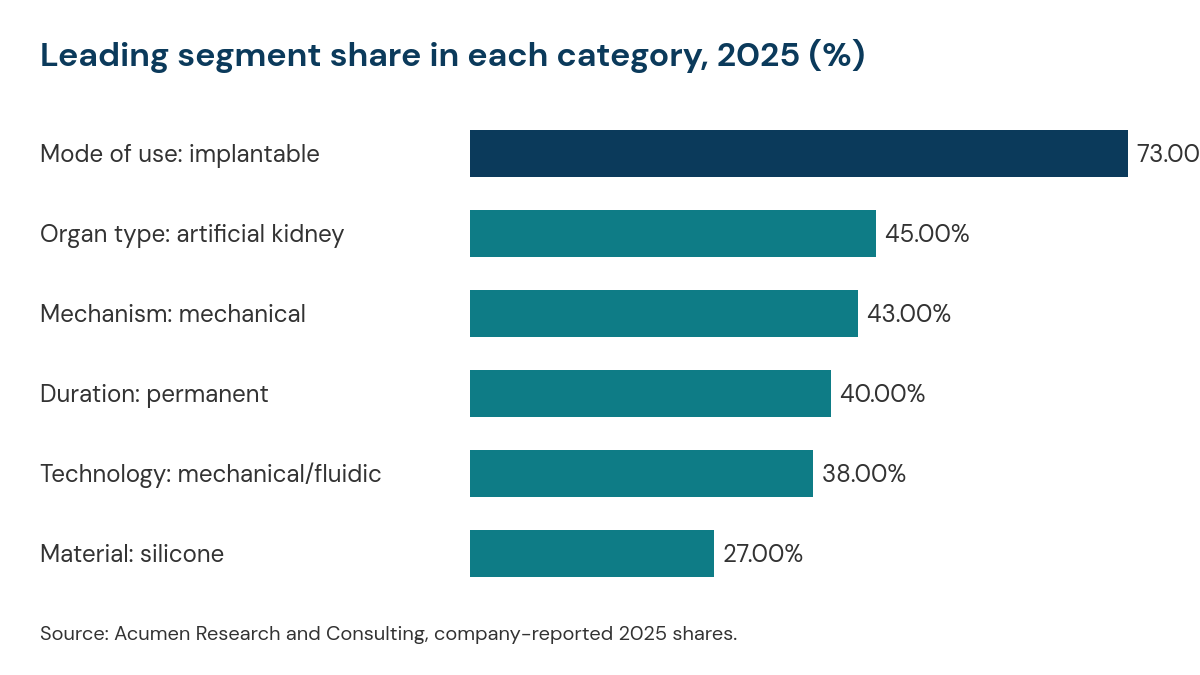
Acumen breaks the artificial organs market into several dimensions. The table and chart below summarise the leading segment in each. Shares are for 2025 and are company-reported estimates.
By organ type
Artificial kidney dominated with a 45.00% share, owing to sustained demand for renal replacement therapy, established treatment infrastructure and the recurrent requirement for kidney-support systems. Artificial liver is projected to be the fastest-growing segment at a 28.6% CAGR from 2026 to 2035. A growth rate that high usually reflects a small starting base, so readers should not read it as a sign that liver devices will rival kidney devices soon.
By fixation and mode of use
Implantable artificial organs held 73.00%, supported by their ability to give continuous physiological support while reducing dependence on external equipment. Externally worn or wearable organs were second at 17.00%, helped by miniaturised sensors, portable power systems and wireless connectivity.
By duration of use
Permanent artificial organs accounted for the largest share at 40.00%, because patients with irreversible organ dysfunction need durable, dependable solutions. Long-term or chronic artificial organs followed with 35.00%, reflecting prolonged assistance for people with chronic organ malfunction.
By material, technology and mechanism
Silicone led materials with 27.00%, valued for flexibility, durability and chemical stability, with polyurethane and other polymers second at 25.00%. By technology, mechanical or fluidic systems led with 38.00%, ahead of electronic or sensor-controlled systems at 25.00%. By functional mechanism, mechanical artificial organs held 43.00% and electronic or electromechanical organs 27.00%, as sensors, processors and actuators let devices adapt to changing body conditions. Cochlear implants, an example of electronic organ replacement, are covered in our cochlear implant market report.
Restraints and Challenges
The public summary concentrates on growth drivers, so the following constraints reflect our own assessment of the sector rather than figures from the report.
- Cost: artificial organs and the procedures that go with them are expensive, which limits access in price-sensitive health systems.
- Durability and safety evidence: long-term performance, infection and clotting risks require strong data, and regulators such as the US Food and Drug Administration expect robust evidence of safety and performance.
- Reimbursement and skills: coverage varies between countries, and specialist surgical and clinical expertise is concentrated in major centres.
Where the Opportunities Are
Likely openings include wearable and implantable devices with built-in sensing, liver-support systems moving from hospital to broader use, and bioengineered or 3D-printed components. Companies that lower cost while proving durability are best placed to serve patients who today rely on dialysis or on waiting for a donor. Transplant medicine also depends on drug therapy, as covered in our organ transplant rejection medication market report, and device makers are active in neighbouring fields, as shown by recent Terumo deal news.
What the Forecast Means: Our Assessment
In our assessment, the direction of the forecast is credible: donor shortages, chronic disease and ageing populations support steady demand, and the shares point to a market still led by mature kidney and mechanical technologies. The most dynamic areas, artificial liver and electronic or sensor-controlled devices, start from smaller bases.
The public page does not explain how the market was defined or how segments were sized, and share figures for each category do not add to 100% in the summary. For decisions, readers should combine this projection with device approvals, transplant registry data and company filings.
Frequently Asked Questions
How big is the artificial organs market?
Acumen Research and Consulting estimates it at US$28.71 billion in 2025, projected to surpass US$63.31 billion by 2035.
What is the expected growth rate?
The projected CAGR is 8.2% over 2026-2035.
Which region leads the artificial organs market?
North America led with 39.96% in 2025 and is projected to grow at 8.8% a year. Europe was second at 27.86%, growing at 8.6%.
Which organ segment is largest and which is growing fastest?
Artificial kidney is largest at 45.00%, and artificial liver is the fastest-growing at a 28.6% CAGR.
Are most artificial organs implanted or worn?
Implantable devices held 73.00% in 2025, and externally worn or wearable devices held 17.00%.
How we reported this: figures come from the public market data of Acumen Research and Consulting and are company-reported estimates. The 2026 value and yearly chart values are our own calculations. Last updated 2 October 2026. This article is for information only and is not medical, investment or business advice.