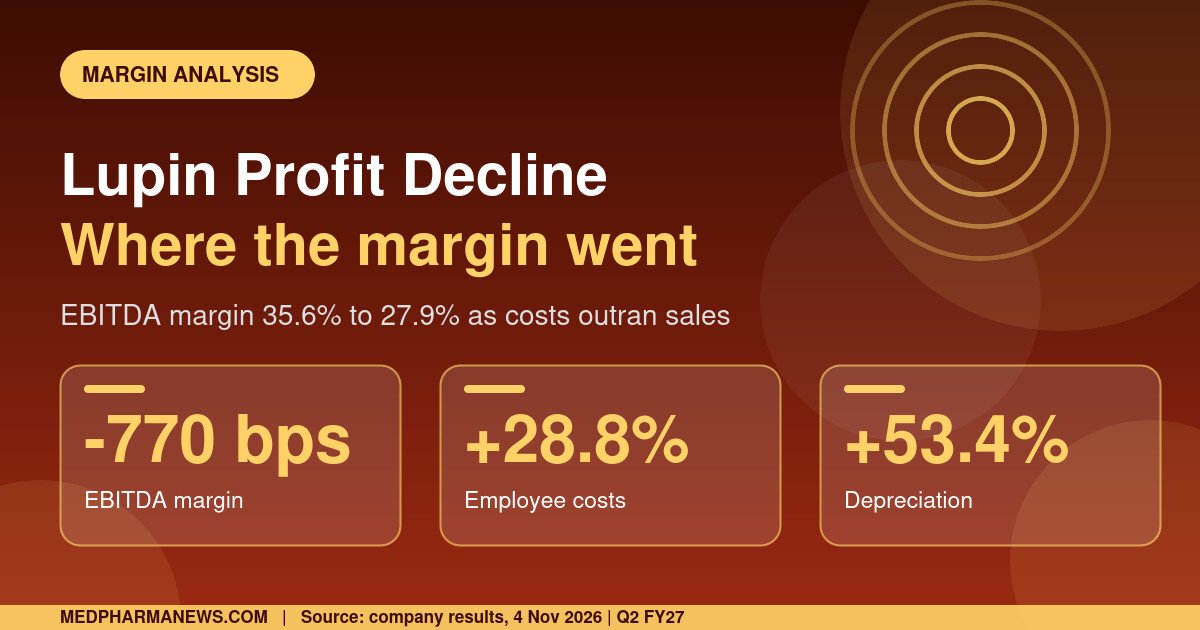
The Lupin profit decline in the quarter ended 30 September 2026 was sharp: net profit fell 22.2% to ₹1,155.3 crore from ₹1,484.8 crore, even though consolidated sales rose 14% to ₹7,785.5 crore. EBITDA margin dropped from 35.6% to 27.9%, a fall of about 770 basis points. This business analysis breaks down the cost lines behind the squeeze, tests the revenue mix and sets out the questions investors and partners may want management to answer. It is news reporting and not investment advice.
Key takeaways on the Lupin profit decline
- Net profit: ₹1,155.3 crore, down 22.2% year on year and down 18.5% from ₹1,417 crore in the previous quarter.
- EBITDA: ₹2,171 crore, down 10.7%; margin 27.9% against 35.6%.
- Costs: employee costs up 28.8%, manufacturing and other expenses up 23.2%, depreciation, amortisation and impairment up 53.4%.
- Other operating income fell from ₹216.1 crore to ₹41.8 crore.
- Gross profit rose 15.4% to ₹5,777.4 crore, a gross margin of 74.2%.
Anatomy of the margin squeeze
| Line | Q2 FY27 | Change |
|---|---|---|
| Gross profit | ₹5,777.4 crore | +15.4% |
| Employee costs | ₹1,423.6 crore | +28.8% |
| Manufacturing and other expenses | ₹2,438.1 crore | +23.2% |
| Depreciation, amortisation, impairment | ₹485.9 crore | +53.4% |
| EBITDA | ₹2,171 crore | minus 10.7% |
| Profit before tax | ₹1,579.6 crore | minus 21.3% |
| Net profit | ₹1,155.3 crore | minus 22.2% |
Gross profit grew faster than sales, so the pressure did not come from the cost of goods. It came from operating expenses and from a sharp drop in other operating income. By our calculation, the employee and manufacturing cost increases together added roughly ₹900 crore against a year earlier, while gross profit added only about ₹770 crore, which accounts for much of the EBITDA fall. The depreciation rise, which includes impairment, pushed profit before tax down further.
Three ways to read the squeeze (our framing)
The first reading is investment. A company expanding capacity, headcount and R&D will often show costs ahead of revenue, and the R&D rise to ₹618.1 crore, or 7.9% of sales, is consistent with this. If so, margins could recover as the new capacity fills. The second reading is structural pressure: wage inflation, compliance spending and competitive pricing can lift costs permanently, which would imply a lower margin base. The third is timing and one-offs, such as impairment inside the depreciation line or the swing in other operating income, which could reverse. The material available does not tell us which reading is correct, and the answer may be a mix of all three.
For investors and partners, the practical test is the next two quarters. If EBITDA margin stabilises near 28% the cost base has probably reset. If it moves back toward 32% or higher, the quarter may have contained temporary items. Those thresholds are our illustration and not company guidance.
What a lower margin means for partners and customers
For licensing partners, distributors and customers, a lower margin at a large supplier is not in itself a warning sign, since Lupin holds net cash and its sales are growing in most regions. The questions that matter are practical: whether supply reliability, regulatory standing and investment in new products remain on track. Pricing discipline in the US generics market and the pace of Indian brand launches are the commercial levers that most affect future margins, and neither was quantified in the material available. Partners should therefore watch operational signals such as approvals and launches alongside the financial results.
The revenue side
| Region | ₹ crore | Change |
|---|---|---|
| United States | 3,020.2 | +9.3% |
| India | 2,383.6 | +14.7% |
| Other developed markets | 1,182.3 | +45.7% |
| Emerging markets | 890.8 | minus 3.5% |
| API | 308.6 | +20.2% |
Revenue growth was broad but uneven. The US contributed about 39% of sales but grew slower than the group, while other developed markets grew 45.7%. Emerging markets shrank. R&D spend rose to ₹618.1 crore, or 7.9% of sales, from ₹522.2 crore, or 7.6%. The company holds net cash, with net debt of minus ₹3,349 crore, and capital expenditure for the quarter was ₹223 crore.
What management said, and did not say
The managing director, Nilesh Gupta, described a strong first half of FY27 with sustained profitability and acknowledged near-term challenges. The material available does not explain the cost increases, mention one-off items or provide margin guidance. Without those, it is not possible to tell whether the squeeze is temporary, reflects investment in capacity and people, or marks a new cost level.
Questions for management (our framing)
- How much of the 28.8% rise in employee costs is new hiring and how much is one-off or annualised?
- What drove the 53.4% rise in depreciation, amortisation and impairment, and how much is impairment?
- Why did other operating income fall by about ₹174 crore?
- What margin range does management expect for the second half?
Timeline
- Quarter ended 30 September 2026: Q2 FY27 trading period.
- 4 November 2026: results announced.
- Second half of FY27: next margin test.
Market context
According to Acumen Research And Consulting, the global pharmaceutical market was USD 1.5 trillion in 2022 and is projected to reach USD 2.8 trillion by 2032, a compound annual growth rate of 6.4% for 2023 to 2032, with North America at about 38% and anti-infectives the largest therapeutic share. The page also has a conflicting 38.4% growth line and was published in July 2024, so it is indicative only. A market growing at about 6% a year does not explain a 14% sales gain, so the growth is company-specific.
Our analysis
In our assessment, the quarter looks like a growth-with-investment story rather than a demand problem, but that is an interpretation, not a disclosed fact. The decisive evidence will be whether margins recover in the second half or settle lower. We make no forecast of earnings or share price.
What is not disclosed
- Breakdown of cost increases.
- One-off items and impairment amounts.
- Margin guidance.
- Product-level sales.
Risks and caveats
- Figures come from company results as reported and need checking against the filing.
- Our calculations are approximate.
- Market data are dated and inconsistent.
- This article is not investment advice.
What to watch next
- Q3 FY27 margins.
- Cost disclosures.
- US launches.
- Emerging-market trend.
General background
Related coverage: India cancer medicine price revisions. Filings are available at the NSE and Lupin website. More in the pharmaceuticals section.
Questions readers are asking about the Lupin profit decline
How much did Lupin profit fall?
22.2%, to ₹1,155.3 crore.
What happened to margins?
EBITDA margin fell from 35.6% to 27.9%.
Did sales fall too?
No. Sales rose 14%.
FAQ
What is a basis point?
One hundredth of a percentage point.
What is impairment?
A write-down of an asset whose value has fallen.
What is other operating income?
Operating income outside product sales.
How we reported this: figures come from Lupin’s quarterly results for the period ended 30 September 2026 as reported on 4 November 2026; market figures are attributed to Acumen Research And Consulting; calculations marked as ours are our own. Last updated 5 November 2026. This is news reporting and not investment advice.