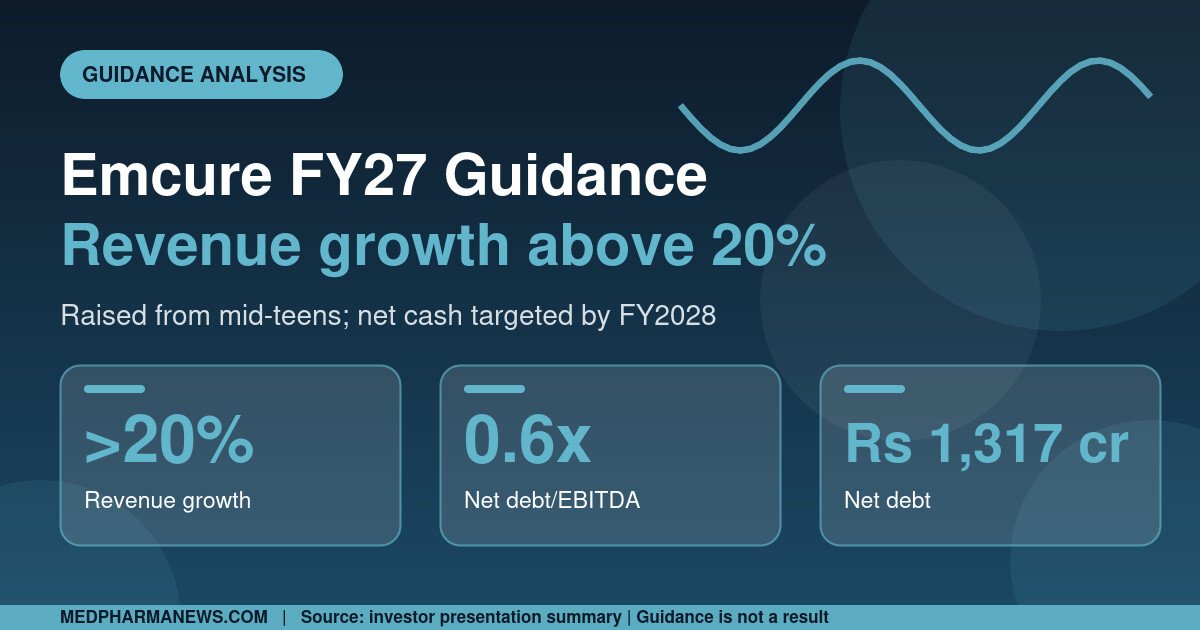
The Emcure FY27 guidance was raised alongside the second-quarter results announced around 3 November 2026: management now expects revenue growth above 20% for the year ending March 2027, up from mid-teens. It also expects EBITDA margin expansion near the upper end of 75 to 100 basis points, domestic growth at or above industry growth, and net cash by FY2028. Guidance is a company expectation and not a result, and the figures here come from a summary of the investor presentation and press reports. This business analysis looks at how plausible the outlook is, what it depends on and what is not disclosed. It is not investment advice.
Key takeaways on the Emcure FY27 guidance
- Revenue growth: above 20% for FY27, raised from mid-teens.
- Margins: EBITDA margin expansion near the upper end of 75 to 100 basis points.
- Domestic: growth at or above industry growth.
- Balance sheet: target of net cash by FY2028; net debt was ₹13,171 million at the end of September, up from ₹10,538 million in March.
- Quarter: revenue ₹28,205 million, up 24.3%; net profit ₹3,251 million, up 29.3%.
How the guidance compares with the run rate
The second quarter grew 24.3%, and the first half net profit grew 33%, so the raised outlook of more than 20% is consistent with recent performance. By our calculation, a full-year result above 20% requires the second half to grow at a broadly similar pace, since the first half has already come in above that mark. The guidance therefore asks management to hold, not accelerate, the run rate.
| Item | Reported | Guidance |
|---|---|---|
| Revenue growth | 24.3% in Q2 | Above 20% for FY27 |
| EBITDA margin | 20.4%, up 103 bps in Q2 | Expansion near upper end of 75 to 100 bps |
| Domestic growth | 12.0% in Q2 | At or above industry |
| Net debt | ₹13,171 million | Net cash by FY2028 |
What drives the growth
International sales grew 34.5% to ₹16,652 million, with Europe up 36.0%, Canada up 24.0% and the rest of the world up 41.1%. Domestic sales grew 12.0% to ₹11,553 million. By our calculation, international sales are about 59% of revenue and not the 78.6% stated in the source, which appears to be an error. This mix means the outlook leans on overseas markets, where currency, pricing and tender conditions can move quickly.
Cash and debt
First-half cash from operations was ₹7,235 million against ₹2,562 million a year earlier, with capital expenditure of ₹2,877 million. Net debt rose because of the Mantra earn-out and Gennova consolidation payments. The company quotes net debt to EBITDA of 0.6 times and ROCE of 24.9%. The net cash target by FY2028 implies that debt falls meaningfully over roughly five quarters of reporting, but no detailed bridge was disclosed.
Execution risks (our framing)
- Overseas concentration: international business is the main growth engine.
- Margin pressure: gross margin is lower than a year earlier despite a quarterly improvement.
- Acquisition-related cash calls: earn-outs and integration payments can arrive faster than debt falls.
- Domestic competition and pricing rules in India.
Scenarios to keep in mind (illustrations, not forecasts)
Consider three ways the second half could unfold. In a steady case, international growth stays strong and domestic growth edges up, so the company lands near or above 20%. In a softer case, European pricing or Canadian tender timing weighs on overseas sales, and full-year growth falls toward the low end of the range. In a debt-heavy case, further acquisition-related payments slow the move to net cash even if profits hold. The company has not described any of these cases, and we do not assign probabilities.
Questions a partner or analyst might ask management
- How much of the international growth is volume and how much is price or currency?
- What is the schedule of remaining earn-out and consolidation payments?
- Which therapy areas drive the domestic recovery from about 10% to 12%?
- What is the reconciliation between adjusted and reported profit?
Source conflicts
One report gives profit growth of 34% on ₹325.5 crore, while the presentation summary and another report give 29.3%. We use 29.3%. The adjusted versus reported profit split is not disclosed. Press reports said the shares rose about 10% after the results; this article does not comment on the share price.
Timeline
- Q1 FY27: domestic growth about 10%.
- 3 November 2026: Q2 results and raised guidance.
- March 2027: end of FY27.
- FY2028: net cash target.
Market context
According to Acumen Research And Consulting, the global pharmaceutical market was USD 1.5 trillion in 2022 and is projected to reach USD 2.8 trillion by 2032, a compound annual growth rate of 6.4% for 2023 to 2032, with North America at about 38% and anti-infectives the largest therapeutic share. The page also quotes a conflicting 38.4% growth figure and dates from July 2024. Emcure’s growth above 20% is far faster than the stated market rate, which shows that the guidance rests on company-specific drivers.
Our analysis
In our assessment, the raised guidance is credible against the first-half run rate but leaves little margin for a slowdown in international markets. The net cash target is the more demanding commitment because it depends on cash generation outpacing acquisition payments. We make no forecast of earnings or share price.
What is not disclosed
- The bridge from net debt to net cash.
- Adjusted versus reported profit.
- Therapy-level or product-level sales.
- Currency assumptions.
Risks and caveats
- Guidance is a company expectation and not a result.
- Figures come from a presentation summary and press reports.
- Source conflicts exist.
- This article is not investment advice.
What to watch next
- Q3 FY27 results.
- Net debt trend.
- International growth versus domestic.
- Any guidance revision.
General background
Related coverage: India cancer medicine price revisions. Company information is on the Emcure website, and filings are at the NSE. More in the pharmaceuticals section.
Questions readers are asking about Emcure FY27 guidance
What is the Emcure FY27 revenue guidance?
Growth above 20%, raised from mid-teens.
When does Emcure expect net cash?
By FY2028.
Is guidance guaranteed?
No. It is a company expectation.
FAQ
What is net cash?
Cash exceeding total borrowings.
What is an earn-out?
A deferred payment tied to an acquired business meeting targets.
What is FY27?
The financial year ending 31 March 2027.
How we reported this: figures come from a summary of Emcure Pharmaceuticals’ investor presentation and press reports; market figures are attributed to Acumen Research And Consulting; calculations marked as ours are our own. Last updated 5 November 2026. This is news reporting and not investment advice.